Activity III
|
Activity - III |
|||||||||||||||||||||||||||||||||||||||||||||||||||||
|
Objective: Stochastic modeling of the built-in Xiaomi Mi8 IMU by applying the Allan variance technique and the autocorrelation sequence |
|||||||||||||||||||||||||||||||||||||||||||||||||||||
|
Measurement setup: 3 * Xiaomi Mi8 smartphones 1 * commercial MEMS IMU from XSENS (MTi-G-710) à for comparisons reasons. The three smartphones + XSENS-IMU were placed in a room with constant temperature, less human influence, eg vibration through walking persons. The measurement time span is around 1 hour. |
|||||||||||||||||||||||||||||||||||||||||||||||||||||
|
Processing tools
|
|||||||||||||||||||||||||||||||||||||||||||||||||||||
|
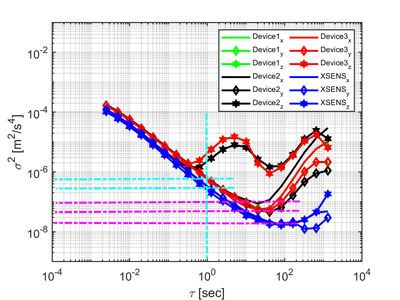
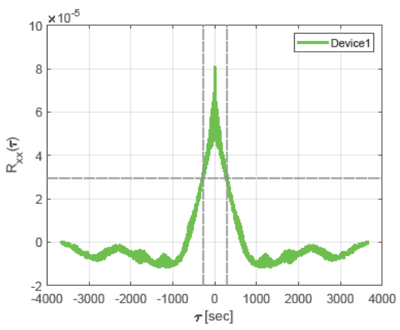
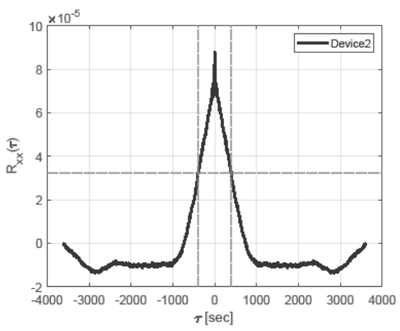
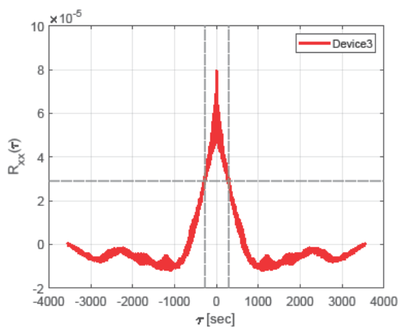
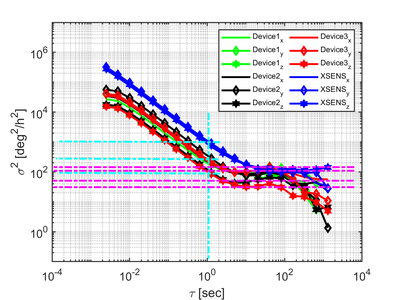
Results: The Mi 8 accelerometer axis shows different stochastic behavior, especially the z-axis, where a 1st Order Gauß-Markov model can be identified (see Figure 1) All three Mi8 show the same stochastic behavior X and Y-axes contain white noise (slope -1/2) and bias instability (the flat region with slope = 0) Z-axis noise can be modeled as the 1st GM model (see. Figure 3, Figure 4 and Figure 5) In comparison with the Xsens, the Xiaomi Mi8 accelerometer is less noisy In Figure 1, the AVAR of the Xsens (blue) is located under the AVAR of all Mi8 smartphone accelerometer. The estimated parameters of all these noise sources inherent in the acc. signals are summarized in Table 1. For GM-Process, both error amplitude and the corresponding correlation time () are indicated.
|
|||||||||||||||||||||||||||||||||||||||||||||||||||||
|
Log files: Coming Soon.
|
|||||||||||||||||||||||||||||||||||||||||||||||||||||