Scanning electron microscopy (SEM)
Scanning electron microscopy (SEM)
Environmental Scanning Electron Microscope (ESEM)
A scanning electron microscope (SEM) images the sample surface by scanning it with a high energy beam of electrons in a raster scan pattern. It permits analyzing the surface texture of solids and the characterization of powder samples. Its magnification of max. 1:1000000 x exceeds significantly the possibilities of normal light microscopy which is limited due to the wavelength of the visible light (400-800 nm) while the wave length of electrons is just about 0.008 nm.
The institute’s Zeiss EVO LS15 has a big sample chamber for maximum specimen heights of 145 mm. It is equipped with a nine fold sample changer which permits quick subsequent investigation of various samples. The SEM operates with variable pressure ranging from common high pressure down to the low pressure range (10 to 3000 Pa). Moist samples like e.g. hydrating binder can be in investigated in the environmental scanning electron microscope (ESEM). Thus an ultrathin sputtering with gold or carbon can be avoided which enables the visualization even of very fine structures like crystals of cement hydrates.
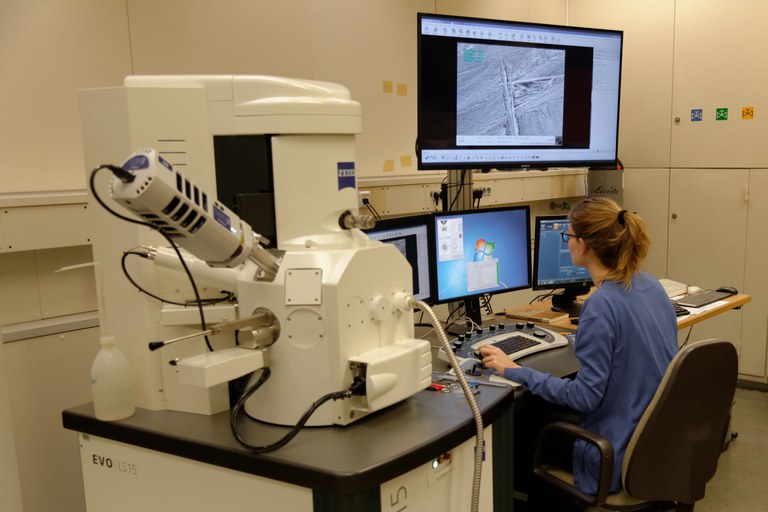
Figure: Environmental scanning electron microscope with attached EDX system on the left
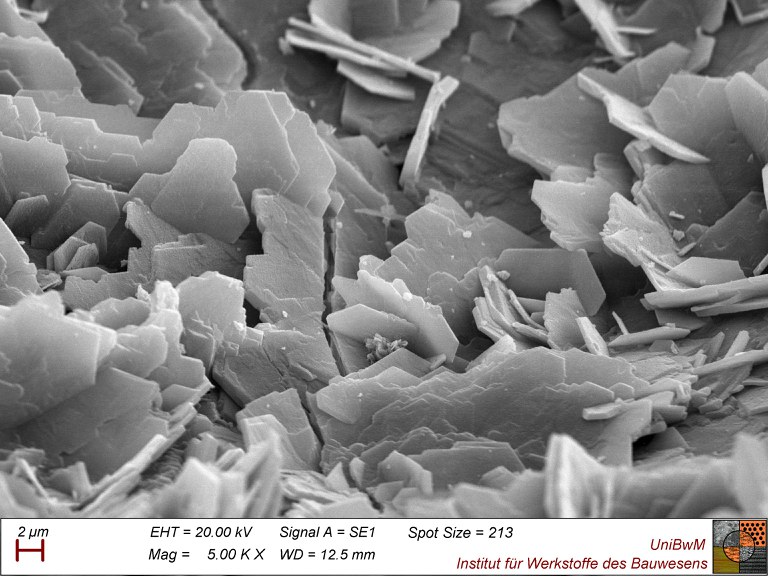
Figure: Portlandite crystals in an air void (5000x magnification)
Energy dispersive X-ray analysis (EDX)
Energy dispersive X-ray analysis (EDX) extends further the experimental opportunities of the SEM. The system uses the characteristic X-rays of atoms as additional secondary signal for a chemical element analysis of the sample surface. The attached Oxford Instruments X-MaxN 50 EDX-system has a SDD-detector (Si(Li)-detector) with an detector area of 50 mm2.
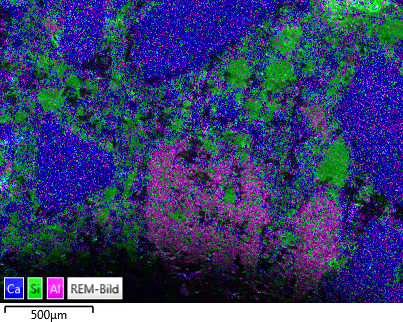
Figure: EDX element mapping of a sand-lime brick sample. For better orientation the X-ray figure is superposed.
Computer tomography (CT)
Computer tomography (CT)
Micro-computer tomography (µCT)
Computer tomography is a three-dimensional imaging technique. It can be applied for non-destructive contact-free analysis of the outer contour and the inner structure of a sample specimen. This is accomplished by taking X-ray absorption pictures from different positions by rotating the sample stepwise. The data obtained are transferred by computer-based calculations into a tree-dimensional image of the sample. The technique permits the very detailed tree-dimensional identification of the internal inhomogeneity of a sample with respect to location, type, size, quantity and distribution. Additionally, information become available about materials of deviating densities within the specimen. Pore volume and other parameters can be calculated with special evaluation software in a further step. The reconstructed data permit the visual investigation of specimen’s contour and sectional images in any direction. The maximum number of sectional images depends upon the resolution of the measurement. The µCT yields a three-dimensional resolution of 5 µm for small samples. Specimens can be investigated with a maximum dimensions of 140 mm in diameter, 200 mm in length and a maximum weight of 1.8 kg.
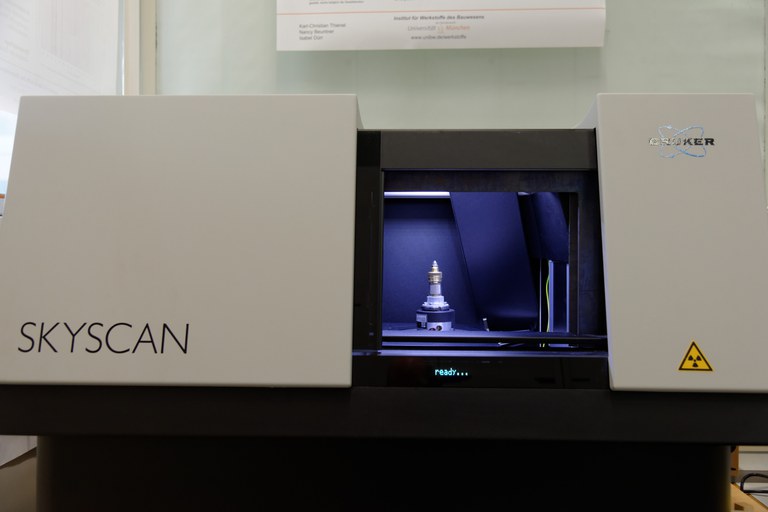
Figure: Bruker SkyScan micro-CT 1173 with sample
Loading stage
The µCT is equipped with a loading stage which enables the observation of crack formation and growth inside a specimen while the actual load is applied. Specimens are loaded in displacement control and the displacement kept constant at predefined stages during the actual scan which ensures distortion free image series.

Figure: Loading stage with concrete sample
Mercury intrusion porosimetry
Mercury intrusion porosimetry
Mercury intrusion porosimetry (MIP)
Mercury intrusion porosimetry characterizes pore sizes and pore size distributions in solids using a low pressure porosimeter (400 Pa) for pore diameter down to 2.5 µm in combination with and involves the use high pressure porosimeter (400 MPa) ) for pore diameter down to 2 nm. The technique involves the intrusion of the non-wetting mercury at high pressure into a porous material. The pore size is proportional to the pressure applied (Washburn’s equation). The measurement can provide information about pore volume and distribution, specific surface, density and particle size of fine dispersed porous materials. The method is standardized in DIN 66133.
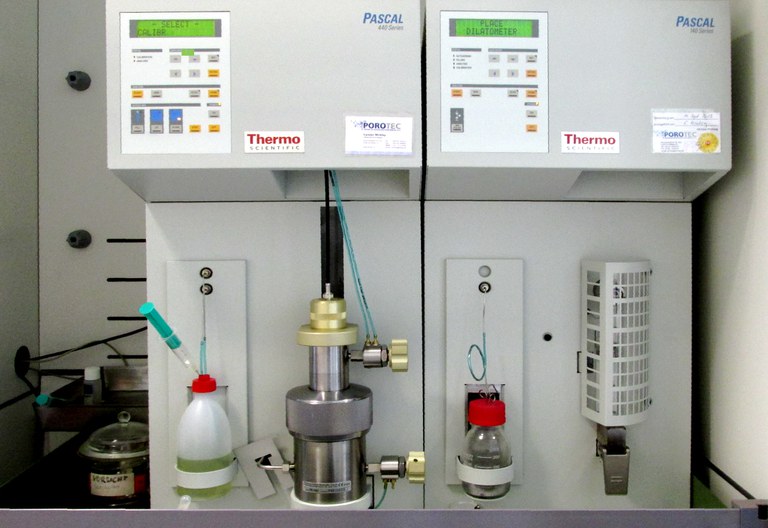
Figure: Mercury intrusion porosimeter Thermo Scientific Pascal 140 and 440
Light microscopy
Light microscopy
Axiocam image processing for light microscopy
A high resolution camera makes pictures taken with light microscopy accessible for digital image processing. So areas, length and angles can be determined directly in a photo. Measuring cracks and pores in concrete becomes possible as well as the visualization of load-induced changes in steel microstructure, the investigation of fracture surfaces, the verification of coating thicknesses and their bond and various other types of deterioration analyses.
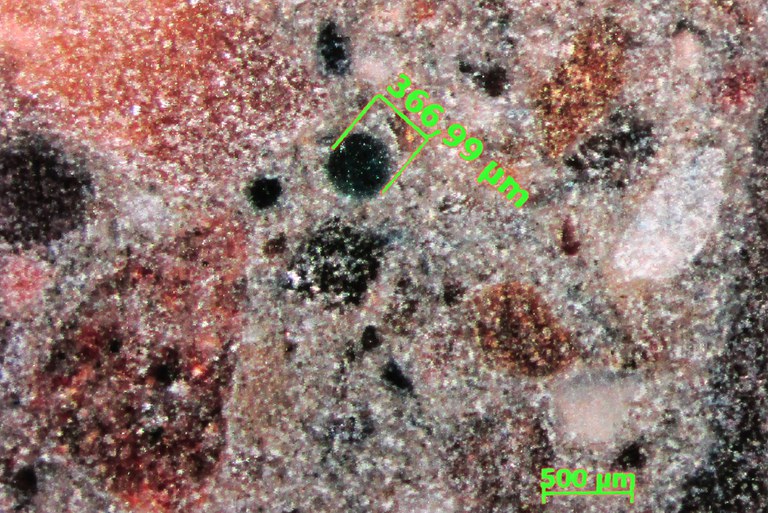
Figure: Concrete sample with measured pores (filled with green resin for better identification)